El Mirage, Arizona

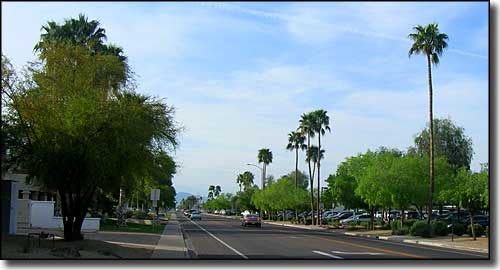
A typical street in El Mirage
El Mirage is a small city in the greater West Valley section of the Phoenix Metroplex. Historically, this was an agricultural area in the Northwest Valley but as the Phoenix area has grown, so has El Mirage. Agriculture does still go on inside the city limits, there's even a regular agriculture irrigation schedule set up and operated by the city water department. But things are not as they were just 20 years ago.
Fast Facts about El Mirage, Arizona
El Mirage, Maricopa County, AZ 85335
Latitude: 33.609°N
Longitude: 112.3246°W
Incorporated: 1951
Elevation: 1,145'
Education:
High School or Higher: 51.2%
Bachelor's Degree or Higher: 5.7%
Graduate or Professional Degree: 0.9%
2011 Cost of Living Index for El Mirage: 90.9
Latitude: 33.609°N
Longitude: 112.3246°W
Incorporated: 1951
Elevation: 1,145'
Education:
High School or Higher: 51.2%
Bachelor's Degree or Higher: 5.7%
Graduate or Professional Degree: 0.9%
2011 Cost of Living Index for El Mirage: 90.9
2009 Estimates:
Estimated Median Household Income: $48,600
Estimated Median Home Value: $155,950
Median Resident Age: 24.6 Years
Major Industries:
Health Care, Construction, Waste Mangement Services, Educational Services, Agriculture, Lodging & Food Services, Entertainment & Recreation, Repair & Maintenance, Government, Automotive Services
Unemployed (March 2011): 12.8%
2010 Population Demographics
| Total Population | 31,797 |
| Males | 15,760 |
| Females | 16,037 |
| Population by Age | |
| Under 18 | 11,278 |
| 18 & over | 20,519 |
| 20-24 | 2,190 |
| 25-34 | 5,625 |
| 35-49 | 6,266 |
| 50-64 | 3,507 |
| 65 & over | 2,049 |
| Population by Ethnicity | |
| Hispanic or Latino | 15,120 |
| Non Hispanic or Latino | 16,677 |
| Population by Race | |
| White | 19,350 |
| African-American | 2,090 |
| Asian | 517 |
| Native American | 451 |
| Hawaiian or Pacific Islander | 88 |
| Other | 7,719 |
| Two or more | 1,582 |
