Mosquero, New Mexico

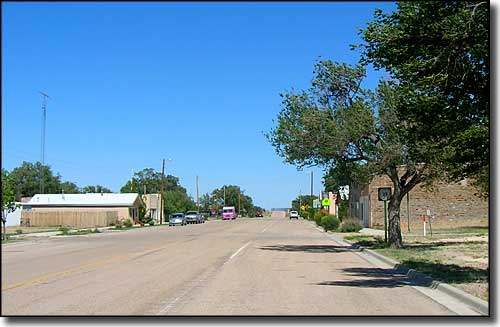
First view of Mosquero
Even though it's the county seat of Harding County, Mosquero is a small hamlet straddling the county line between Harding and San Miguel Counties. This is primarily a big cattle ranching area on the high plains of northeastern New Mexico.
Driving La Frontera del Llano in the summer of 2011, I was surprised at how big Mosquero seemed when compared to the population figures. I was also surprised that I found no gas station in town. The maps had shown a couple spots along the road that used to be: Mills and Solano in particular. Solano still had a church, Mills a Post Office, but neither had much else. I'd say Harding County has a hard time holding onto its population...

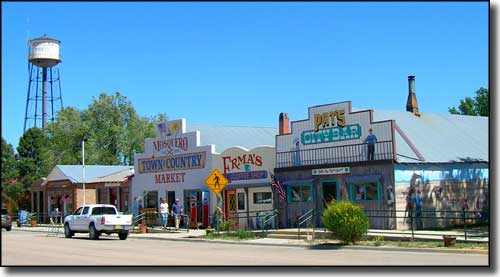
In the business district in Mosquero

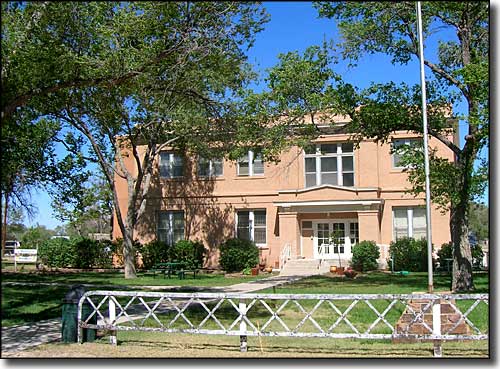
Harding County Courthouse

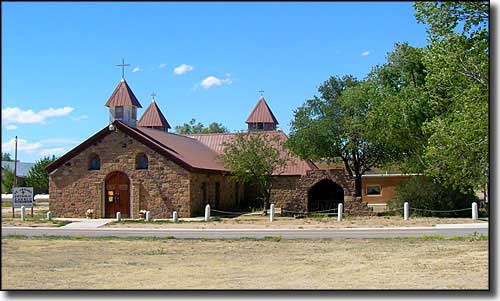
The Catholic Church in Mosquero
Fast Facts about Mosquero, New Mexico
Mosquero, Harding County, NM 87733
Latitude: 35.7763°N
Longitude: 103.9571°W
Unincorporated
Elevation: 5,591'
Education:
High School or Higher: 67.9%
Bachelor's Degree or Higher: 17.0%
Graduate or Professional Degree: 8.9%
2011 Cost of Living Index for Mosquero: 84.5
Latitude: 35.7763°N
Longitude: 103.9571°W
Unincorporated
Elevation: 5,591'
Education:
High School or Higher: 67.9%
Bachelor's Degree or Higher: 17.0%
Graduate or Professional Degree: 8.9%
2011 Cost of Living Index for Mosquero: 84.5
2009 Estimates:
Estimated Median Household Income: $31,040
Estimated Median Home Value: $51,850
Median Resident Age: 51.0 Years
Major Industries:
Educational Services, Agriculture, Government, Chemicals, Construction, Real Estate Services, Social Services, Transportation Services, Lodging & Food Services, Building Materials, Waste Management Services
Unemployed (March 2011): 4.8%
Population Demographics: 2010
| Total Population | 93 |
| Males | 45 |
| Females | 48 |
| Population by Age | |
| Under 18 | 9 |
| 18 & over | 84 |
| 20-24 | 2 |
| 25-34 | 4 |
| 35-49 | 12 |
| 50-64 | 25 |
| 65 & over | 40 |
| Population by Ethnicity | |
| Hispanic or Latino | 53 |
| Non Hispanic or Latino | 40 |
| Population by Race | |
| White | 79 |
| African-American | 0 |
| Asian | 0 |
| Native American | 1 |
| Hawaiian or Pacific Islander | 0 |
| Other | 12 |
| Two or more | 1 |
