East Carbon, Utah

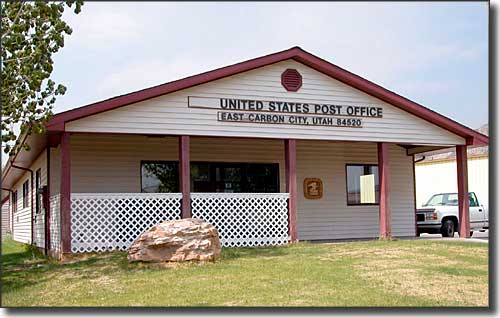
The East Carbon City Post Office

As Utah goes, East Carbon is a relatively new town. Previous to July 23, 1973, East Carbon was two struggling mining towns named Columbia and Dragerton.
Dragerton was founded in 1942 as a development of the Defense Plant Corporation. It was originally named for WL Drager, the chief engineer for the Defense Plant Corp. but when the Post Office was opened, the Postal Service rejected the name saying it too closely resembled "Draper," the name of another Utah town. So the name was changed to Dragerton.
In the late 1960's, the population in the area was peaking (folks didn't know it at the time) and they needed to build a new high school. Dragerton and nearby Sunnyside competed for the school to be built within their city limits and, in the end, Sunnyside won out with the school being built just inside the Sunnyside city limit. Then the school district named it East Carbon High School. So when Dragerton and Columbia were merged and incorporated, the folks thought changing the city name to East Carbon was, in effect, retaking the high school. Then the high school was torn down and an elementary school was built in the same place.
Columbia was located about 4 miles southeast of Dragerton and even though it is now officially part of East Carbon City, most folks still call it Columbia.
Latitude: 39.5426°N
Longitude: 110.41°W
Incorporated: 1973
Elevation: 5,987'
Education:
High School or Higher: 69.4%
Bachelor's Degree or Higher: 6.3%
Graduate or Professional Degree: 2.4%
2011 Cost of Living Index for East Carbon: 82.5
Median Resident Age: 40.9 Years
Estimated Median Household Income: $31,150
Estimated Median Home Value: $50,900
Population Density: 142 People per Square Mile
Major Industries:
Mining, Oil & Gas Extraction, Educational Services, Health Care, Waste Management Services, Lodging & Food Services, Construction, Government, Professional Services, Transportation Services
Unemployed (March 2011): 7.6%
Population Demographics: 2010
| Total Population | 1,301 |
| Males | 626 |
| Females | 675 |
| Population by Age | |
| Under 18 | 302 |
| 18 & over | 999 |
| 20-24 | 90 |
| 25-34 | 144 |
| 35-49 | 182 |
| 50-64 | 320 |
| 65 & over | 239 |
| Population by Ethnicity | |
| Hispanic or Latino | 274 |
| Non Hispanic or Latino | 1,027 |
| Population by Race | |
| White | 1,177 |
| African-American | 7 |
| Asian | 2 |
| Native American | 12 |
| Hawaiian or Pacific Islander | 0 |
| Other | 56 |
| Two or more | 47 |
