Pima, Arizona

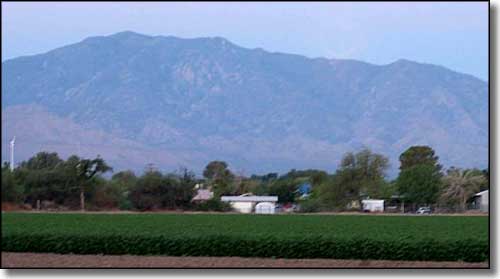
Pima sits at the foot of Mt. Graham
Pima is one of a very few Mormon settlements that weren't planned by the leadership of the LDS church. The first settlers arrived in 1879 after being told they had to leave their previous settlement (Forrest Dale) because it was on Indian land. Originally, they called this new site "Smithville" but that name was changed to Pima (in honor of the local Native American tribe) in 1884. The Pima Branch was organized into a formal ward within the St. Joseph Stake in 1880. The site of Pima was chosen because a scouting expedition had determined that that was probably the easiest and best place to dig a usable irrigation canal for the watering of the soon-to-be farmlands. What's interesting in the old histories of the area is that when the Mormons arrived, a lot of the countryside had already been occupied by non-Mormons characterized as "outlaws, horse thieves and speculators." However, if it wasn't for the help given by the outlaws, horse thieves and speculators, the incoming Mormons would have had a much harder (and perhaps less fruitful) time of it. And these new settlers had already been frustrated in their attempts to settle further north in Arizona along the Little Colorado River.
Today, Pima is still mostly an agricultural community but more and more copper miners are living here... Pima is also becoming known as a tourism and retirement destination with a lot of easily accessible outdoor activities and recreational facilities located nearby.
Latitude: 32.8886°N
Longitude: 109.8283°W
Incorporated: 1884
Elevation: 2,838'
Education:
High School or Higher: 75.3%
Bachelor's Degree or Higher: 13.1%
Graduate or Professional Degree: 4.8%
2011 Cost of Living Index for Pima: 84.1
Estimated Median Household Income: $61,800
Estimated Median Home Value: $110,900
Median Resident Age: 30.1 Years
Population Density: 870 People per Square Mile
Major Industries:
Educational Services, Mining, Construction, Lodging & Food Services, Government, Health Care, Agriculture, Social Services, Retail Services, Truck Transportation
Unemployed (March 2011): 11.0%
2010 Population Demographics
| Total Population | 2,387 |
| Males | 1,205 |
| Females | 1,182 |
| Population by Age | |
| Under 18 | 830 |
| 18 & over | 1,557 |
| 20-24 | 155 |
| 25-34 | 292 |
| 35-49 | 386 |
| 50-64 | 366 |
| 65 & over | 296 |
| Population by Ethnicity | |
| Hispanic or Latino | 500 |
| Non Hispanic or Latino | 1,887 |
| Population by Race | |
| White | 2,086 |
| African-American | 9 |
| Asian | 3 |
| Native American | 15 |
| Hawaiian or Pacific Islander | 3 |
| Other | 184 |
| Two or more | 87 |
